


Overview
The U.S. labor market keeps powering ahead, clocking more than seven years of robust job growth (and counting). But has it been enough to absorb all the slack from the Great Recession? We think so. Although we can't be certain that "full employment" has been reached - meaning that all remaining unemployment is purely frictional (reflecting normal delays in jobless people being matched to available jobs), or structural (people who don't have the required skills or desire to fill available opportunities), but not cyclical (due to depressed labor demand). In other words, this development suggests that all those who can and want to work full time are doing so, and those who are out of the labor force are there as a life choice, not as a response to temporarily inadequate job opportunities. To our judgment, the United States is close, if not even a shade beyond full employment. Labor markets appear to have recovered roughly to where they were in late 2006/early 2007, before the financial crisis. They seem not as tight as in some earlier periods, though, especially in the late 1960s and early 1950s, when full employment was materially breached. Even at the peak of the late-1990s/2000 boom, we felt that labor markets were slightly tighter than they are today. But they will be there before long if current trends persist.
Tight labor markets have their upsides. They can help cement inflation's move back up to the U.S. Federal Reserve's (the Fed's) target, reminding people accustomed to sub-par inflation that 2% is not a ceiling but a truly symmetric target, thus solidifying their long-term expectations around that target. Also, drum-tight labor markets might draw more people into the labor force and keep them there, lifting the economy's long-run growth potential. They may also help reverse the tilt of income toward capital and away from labor that has contributed to rising inequality. But white-tight labor markets are not devoid of risks. The more materially full employment is exceeded, the greater the chance that untoward inflation pressures and destabilizing economic and financial excesses will build. Unsustainably tight labor markets can be hard to unwind seamlessly- difficult to be cooled just enough to ease the strains without sending the economy into a tailspin. Achieving that kind of "soft landing" has proven challenging historically, all the more so the tighter labor markets become. Though not an immediate concern, it is a risk that looms over the horizon if the labor market continues to tighten.
Gauging the tightness of the labor market: Headline unemployment
The most widely watched measure of labor utilization is the headline-unemployment rate, or U3. From a peak of near 10% in the aftermath of the financial crisis, it has fallen to 3.8%, the lowest since 2000, and below what many consider to be the natural rate, consistent with full employment and stable inflation, which the Congressional Budget office (CBO) and Federal Open Market Committee (FOMC) participants, for example, currently peg at around 4.5%. On this metric, then, the labor market has already modestly overshot full employment, roughly comparable to what happened in late 2006/early 2007. However, not quite as much as at the peak of the tech boom in early 2000 (when the natural rate was judged to be somewhat higher than today), and well shy of the overshoots during the Korean and Vietnam wars.
Keep in mind, though, that estimates of the natural rate are uncertain and often change, sometimes after the fact. Structural shifts in the labor market, including its ability to match potential workers with available jobs, can influence the natural rate of unemployment, as can variations in the age, education, and skills of the working-age population, often in ways that are hard to estimate. The natural rate seemed substantially higher in the 1970s and 1980s, for example, as the labor market struggled to absorb an influx of new entrants, mainly baby boomers and women. In the past few years, by contrast, estimates of the natural rate have edged lower, reflecting not only a continued trend toward an older, more educated workforce less prone to unemployment, but also an unemployment rate that has fallen to levels near the lower end of the historical range without seeming to engender undue stresses in labor markets. So there may be more to gauging slack than just headline unemployment.
Labor-force participation
There is also estimating how many people are not counted among the official unemployed, but who might be willing to join the labor force if the right opportunities arose. On the surface, it seems there could be a lot of these people. After all, the labor force participation rate (LFPR) is about 3.5 percentage points shy of pre-crisis readings. But the lion's share of that decline, about 85%, is purely demographic, an artifact of the shifting age composition of the population, toward older groups with perennially lower participation rates. The aggregate participation rate is only about one-half percentage point below levels consistent with these underlying demographics (where it would be if participation rates within each age group had remained at pre-crisis levels). And even that may overstate the amount of latent slack because most of the shortfall in participation relative to pre-recession trends is concentrated among those aged 55 - 64, who have not come back even as labor markets have improved in recent years, and whose ability and willingness to do so may be limited.

Those in their prime working years are a more likely source of potential labor. Participation among 25 - 54 year olds has been on the rise for the past few years as job prospects have improved, though, it remains about a percentage point below pre-crisis levels, suggesting scope for further gains. But structural forces may limit that scope. Prime-age participation was edging lower prior to the Great Recession, starting in about 2000, when the rise in female participation began to fade, exposing a downward drift among prime-aged men that began decades earlier and owes to deep-rooted factors (inadequate skills, changes in life-work choices, incarceration, disability, etc.) that may persist. The prime-age participation rate is already back to levels implied by these pre-recession structural trends, and what CBO estimates, is consistent with full employment, suggesting there’s not a lot of room for continued recovery. All told, while there may still be a "participation gap" - a cyclical shortfall of aggregate participation relative to its structural trend - in contrast to 2000, when participation rates seemed a bit beyond levels consistent with full employment, any remaining slack from this source today is likely modest, on our estimates only about 0.5% of the labor force. And if current trends persist, even that will be gone fairly soon, by next year at the latest.
Involuntary part-timers
A potential source of slack that is probably exhausted already is those who are employed part-time but would prefer full-time work. After swelling in the aftermath of the Great Recession, this "underemployment gap" gradually shrank, and on our estimates is now essentially gone.
Indeed, as a share of the labor force, involuntary part-timers are back near levels seen before the crisis and that have historically been associated with full employment. But they’re not quite as low as in 2000 - another hint that the labor market may have been tighter then. Yes, the Affordable Care Act (ACA) may have encouraged firms to substitute part-time for full-time workers (to avoid the health insurance mandate), but the evidence suggests only a slight impact at most 1 - insufficient to overturn our contention that today’s levels of involuntary part-timers are indicative of labor markets being a little less tight than in 2000, but enough to reinforce our conviction that this source of potential slack has largely dried up.
Putting it all together: Aggregate slack
Adding it all up - the unemployment gap, the participation gap, and the underemployment gap - suggests that slack in the labor market is gone, and that the United States may even have moved a hair beyond full employment. On this metric, conditions are approaching those prevailing during the pre-crisis peak, but still short of the tightness seen in 2000, when full employment was breached by close to two full percentage points of the labor force. On current trends, though, the labor market will be that tight again before long, perhaps by late 2019. Of course, this is putting way too fine a point on things, suggesting a degree of precision belied by the uncertainty that surrounds these estimates.

No one knows precisely what the natural rate of unemployment is, or what rates of labor force participation and involuntary part-timers are consistent with full employment. It behooves us to keep an open mind, watch incoming information, and adjust our assessments if necessary. And look at still other metrics as useful cross-checks.
Broader measures of unemployment: The U6
One such measure is the broad unemployment rate, or U6. This includes not only the headline unemployed captured in the U3, but also involuntary part-timers, and those who identify as not actively looking for work but who have searched at some time in the past year and would want a job if one were available (this latter group, often said to be "marginally attached" to the labor force, offers a useful cross-check on our estimates of the participation gap). The U6 has fallen sharply, from a peak of over 17% in 2009 to just over 7.5% now, though unlike the U3 it is still above its 2000 lows (by about three-quarters of a percentage point). In other words, the U6 has declined a bit less than might have been expected given the fall in the U3. Flipping it around, had headline unemployment tracked the U6, in keeping with historical patterns, it would be about 0.5% higher than it is, suggesting that labor markets may not be quite as tight as the U3 indicates, or as they were in 2000. But they are getting close.

Employment
Another way to assess slack in the labor market is by focusing not on unemployment but employment. As a share of the working-age population, employment has retraced not quite half of its post-crisis decline, and at just under 60.5% is still two and one-half percentage points below late-2006/early-2007 readings - suggesting, at first blush, that the labor market is far from fully healed. But once again, we need to take demographics into account. Adjusting for the aging population, the overall employment- population ratio is back near pre-crisis levels (i.e., where it would have been had the ratios within each age group remained steady), and what CBO reckons is consistent with full employment, though at the peak of the 1999/2000 boom, this metric exceeded levels deemed consistent with full employment by more than a percentage point - further evidence that labor markets were tighter then. For those in their prime-working years, the employment-population ratio is still about a percentage point shy of pre-crisis readings, but slightly above that implied by its declining pre-recession trend, and by what CBO estimates is compatible with full employment, albeit by less than the overshoot seen at the 2000 peak.

Employment estimates from the establishment survey paint a broadly similar picture. Despite more than seven years of gains averaging 200 thousands per month, the staggering losses in 2008-'09 imply that for the cycle as a whole, nonfarm payrolls have increased an average of only 82 thousands per month. Still, that's in the ballpark of what has been needed to keep up with trend growth in the labor force, which we peg at about 75-100 thousands per month - toward the lower end of that range when cyclical weakness in the labor market reinforces the downward pressure of demographics on the participation rate, as it did earlier in the cycle, and slightly above that range (perhaps 100-125 thousands) if cyclical strength temporarily offsets the demographic effect, leaving the participation rate roughly unchanged, as in the past couple of years. Either way, though, the current pace of payroll growth (almost 200 thousands per month) is far more than enough, and if it continues, will keep labor markets tightening, eventually pushing materially beyond full employment.

Other indicators
There are still other ways of taking the labor market's pulse. One is to track how many people are willing to quit their jobs - something they’re typically reluctant to do when prospects are dim, but more willing when opportunities abound. The quit rate fell to a record low in the aftermath of the Great Recession, but has now climbed back above pre-crisis levels, and within shouting distance of what was seen in the drum-tight labor markets of 2000 - which is especially impressive given the long-term, secular trend toward less quitting at any given state of labor-market conditions (reflecting an older, more staid workforce and a general reduction in the dynamism of labor markets).
People clearly feel good about their chances of finding work, and that optimism is echoed in surveys, which show that the share of households who judge jobs as "plentiful," minus those who deem them "hard to get," has rebounded firmly above pre-crisis readings, though not all the way back to 2000 peaks. Small businesses see labor markets especially tight right now, with the share of such firms saying they’re unable to fill positions back at near 2000 highs.


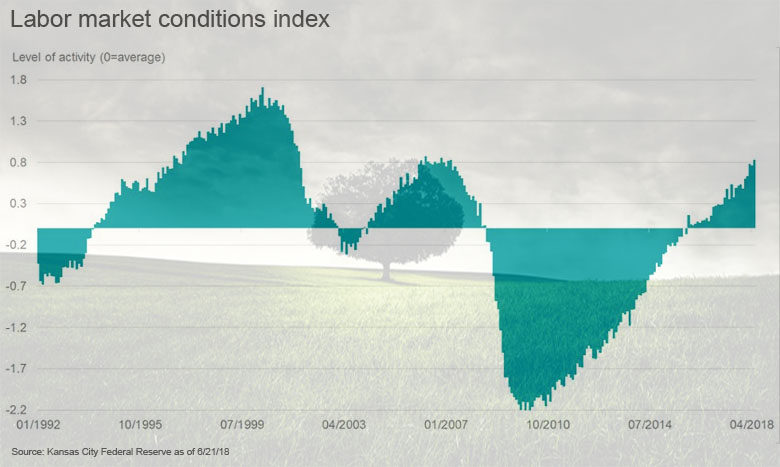
Data on job vacancies confirm this basic story. Indeed, across the labor market as a whole, job openings have increased sharply, reaching all- time highs relative to the number of unemployed, suggesting not only that labor markets are drum tight, but that their ability to match those out of work to available jobs may have deteriorated, perhaps because the unemployed don’t have the skills in demand, or are unwilling/unable to accept the jobs on offer. If so, that would suggest a higher natural rate of unemployment, and tighter labor markets. But these data only go back to December 2000, when the labor market had already begun to cool a bit from its peak of tightness in that cycle. Also, it's easier and less costly to post vacancies now, and there is some evidence suggesting that firms haven't been recruiting as intensively to fill openings, at least earlier in the recovery. 2 What's more, the Kansas City Fed Index of labor market conditions - a compilation of a wide range of indictors - puts the overall level of activity in the labor market back roughly to pre-crisis readings, but still shy of the peaks recorded in 2000.
Labor costs
The behavior of labor costs can also inform our judgments about how tight labor markets are. Almost all measures show labor costs decelerating sharply in the aftermath of the Great Recession and picking up over the past few years, albeit moderately - nothing to indicate firms bidding feverishly for scarce talent, but enough to suggest that labor markets have grown tighter. Bear in mind, though, that labor costs are an imperfect barometer of the degree of slack in the labor market; the relationship is loose and time-varying, prone to lags of variable duration, and often confounded by other influences such as shifts in productivity trends, inflation expectations, the structure of labor market, and the composition of the labor force - all of which can affect labor costs independent of slack. Through much of this cycle, for example, sluggish productivity growth and subdued inflation (and inflation expectations) have likely restrained wage growth for any given level of slack. Also, wages may have been slower to rebound in recent years because they didn’t decelerate as sharply as they would have during the recession had nominal wages not been so downwardly rigid. And the relationship between labor costs and slack - never airtight - has become looser over the past few cycles (i.e., wage Phillips curves have become flatter). Given all that, the recent acceleration in labor costs, though modest, has actually been pretty impressive, suggesting at the very least that slack has dwindled sharply.

All told: Where we are and where we may be headed
Putting it all together, the U.S. labor market seems close to, if not a touch beyond full employment, though not as tight as in some past periods. But it will be there before long if the current momentum persists. That can have benefits but it also carries risks. Not just inflation risks, which may increase the tighter labor markets become (there is some evidence, for example, that the Phillips-curve steepens when labor markets get especially tight). 3 Overly-tight labor markets can also be indicative of broader economic and financial excesses - the kinds of destabilizing imbalances that have often presaged economic slowdowns. And unwinding them seamlessly - cooling them just enough to reverse the excesses, but no so much as to derail the expansion - has historically proven a tough needle to thread. None of this is especially worrisome at the moment, but it’s a risk that could grow if labor markets keep tightening.


Комментариев нет:
Отправить комментарий
Примечание. Отправлять комментарии могут только участники этого блога.